Rebuild UpSet plot color
UpSet plot is a ready-to-use package for visualizing categorical overlaps. But it can be tricky to modify its barplot color and add the bar subclass to allow the additional comparison.
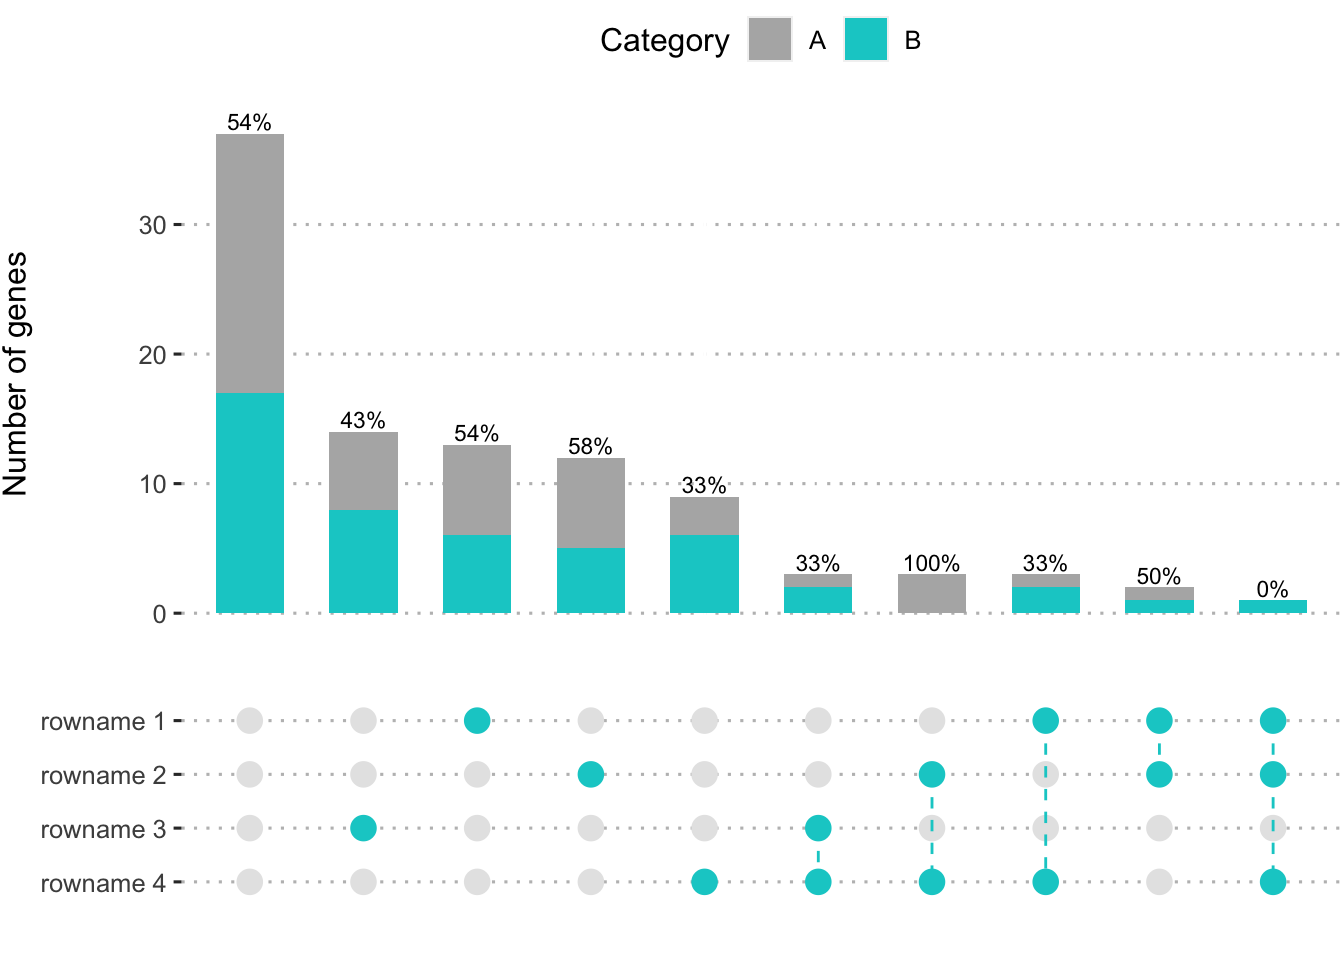
Here, I made the UpSet style plot, which can change color and number of intersections, and keep the top interactions for simplicity.
library(ggplot2)
library(cowplot)

plot_freq_intersect <- function(dat, .by = "Group", .levels = NA, .split = "Category", .color = 1:10, top_n = 10) {
  # Args:
  #   dat: gene_id (unique)
  #   .by: row feature
  #   .levels: dot plot row names
  #   .split: bar split feature

  if (is.na(.levels[1])) {
    .levels <- seq_len(as.character(nchar(dat[1, .by])))
  }

  # limit less frequent groups
  top_groups <- names(tail(sort(table(dat[, .by])), top_n))
  dat <- dat[dat[[.by]] %in% top_groups, ]

  dat$Group <- factor(dat[, .by], levels = names(sort(table(dat[, .by]), decreasing = T)))
  dat$Type <- dat[, .split]

  # barplot
  dat_g1 <- dplyr::count(dat, Group, Type, sort = TRUE)

  frac_tbl <- table(dat[, "Group"], dat[, "Type"])
  frac_tbl <- frac_tbl / rowSums(frac_tbl)

  dat_g1_text <- data.frame(Group = rownames(frac_tbl),
                            Fraction = paste0(round(frac_tbl[, 1], 2) * 100, "%"),
                            Type = colnames(frac_tbl)[1])

  Group_n <- dplyr::count(dat, Group, sort = TRUE)
  dat_g1_text$n  <- Group_n[match(dat_g1_text$Group, Group_n$Group), "n"]

  g1 <- ggplot(dat_g1, aes(x = Group, y = n, fill = Type)) +
    geom_bar(stat = "identity", width = 0.6) +
    geom_text(data = dat_g1_text,
              aes(x = Group, y = n, label = Fraction),
              vjust = -0.25, hjust = 0.5,
              size = 3) +
    xlab("") + ylab("Number of genes") +
    ggpubr::theme_pubclean() +
    scale_fill_manual(name = .split, values = c("grey70", .color)) +
    theme(axis.text.x = element_blank(),
          axis.ticks.x = element_blank(),
          plot.margin = margin(c(0,1,1,1)))

  # dot plot
  dat_tile <- NULL
  for (m in seq_along(levels(dat$Group))) {
    tmp <- cbind(x = m, y = .levels,
                 color = ifelse(strsplit(levels(dat$Group)[m], "")[[1]] == 1, 1, 0))
    dat_tile <- rbind(dat_tile, tmp)
  }

  dat_tile <- as.data.frame(dat_tile)
  dat_tile$x <- factor(dat_tile$x, levels = order(as.numeric(dat_tile$x)))
  dat_tile$y <- factor(dat_tile$y, levels = rev(.levels))

  g2 <- ggplot(dat_tile, aes(x = x, y = y, color = factor(color), group = x)) +
    geom_point(size = 4) +
    scale_color_manual(values = c("grey90", .color)) +
    xlab("") + ylab("") +
    ggpubr::theme_pubclean() +
    theme(panel.grid = element_blank(),
          legend.position = "none",
          axis.text.x = element_blank(),
          axis.ticks.x = element_blank(),
          plot.margin = margin(c(1,1,0,1)))

  # add lines
  dat_seg <- NULL
  for (i in unique(dat_tile$x)) {
    tmp <- dat_tile[dat_tile$x == i, ]
    tmp <- tmp[tmp$color == 1, ]
    if (nrow(tmp) > 1) {
      dat_seg <- rbind(dat_seg,
                       data.frame(x = tmp$x[-nrow(tmp)], y = tmp$y[-nrow(tmp)],
                                  xend = tmp$x[-1], yend = tmp$y[-1]))
    }
  }

  if (!is.null(dat_seg)) {
    levels(dat_seg$x) <- levels(dat_seg$xend) <- levels(dat_tile$x)
    levels(dat_seg$y) <- levels(dat_seg$yend) <- levels(dat_tile$y)
    dat_seg$color <- 1

    g2 <- g2 + geom_segment(data = dat_seg, aes(x = x, y = y, xend = xend, yend = yend), lty = 2)
  }

  cowplot::plot_grid(g1, g2, ncol = 1, align = "v", rel_heights = c(1, 0.4))
}
Below is a toy data set for testing.
gene_set_1 <- sample(100, 20, replace = FALSE)
gene_set_2 <- sample(100, 20, replace = FALSE)
gene_set_3 <- sample(100, 20, replace = FALSE)
gene_set_4 <- sample(100, 20, replace = FALSE)


dat_test <- data.frame(gene_id = 1:100,
                       Category = rep(c("A", "B"), 50))

# convert to group of intersection
dat_test$Group <- paste0(as.numeric(dat_test$gene_id %in% gene_set_1),
                         paste0(as.numeric(dat_test$gene_id %in% gene_set_2),
                                paste0(as.numeric(dat_test$gene_id %in% gene_set_3),
                                       as.numeric(dat_test$gene_id %in% gene_set_4))))

plot_freq_intersect(dat_test, .by = "Group",
                    .levels = c("rowname 1", "rowname 2", "rowname 3", "rowname 4"),
                    .split = "Category", .color = "cyan3", top_n = 10)