Draw a heart
Draw a heart for the one you love.
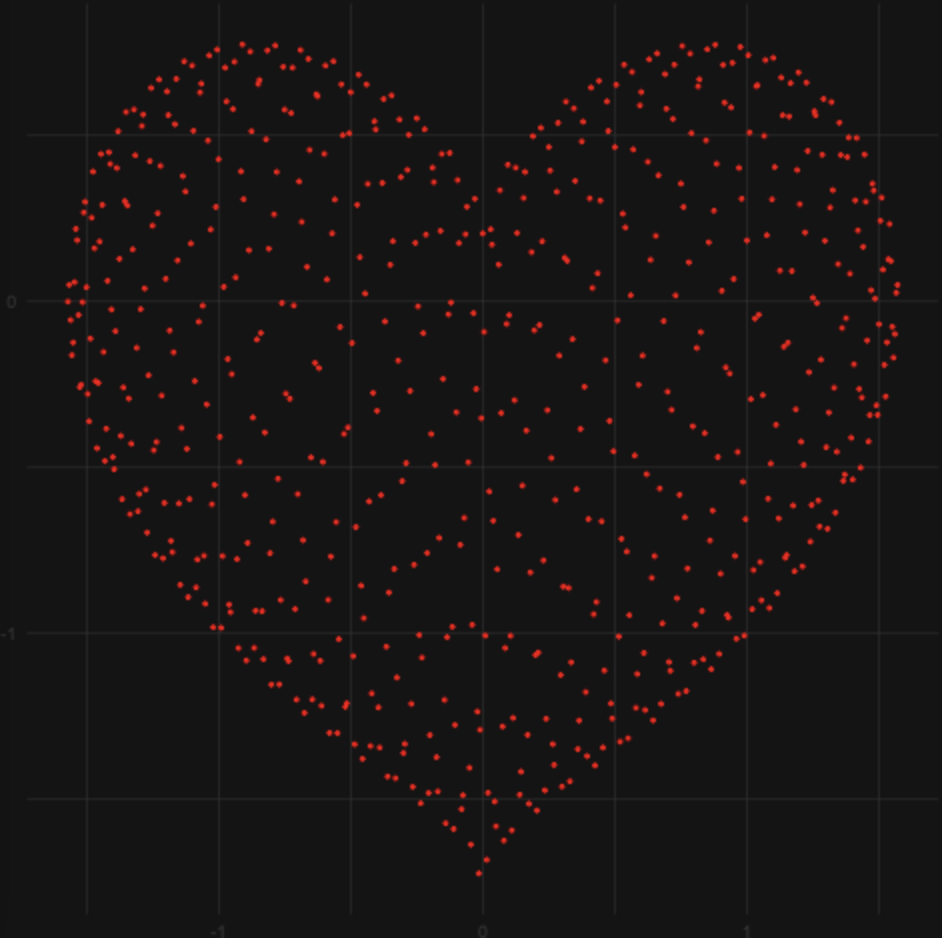
x = seq(-pi/2, pi/2, by = 0.005)
y = (0.64 * sqrt(abs(x)) - 0.8 + 1.2^abs(x) * cos(200*x)) * sqrt(cos(x))
dat <- data.frame(x, y)
dat$z <- seq_len(nrow(dat))

library(ggplot2)
library(gganimate)

ggplot(dat, aes(x = x, y = y)) +
  geom_line(color = 2, lwd = 2) +
  geom_point(color = 'red', size = 1, pch = 20,
             aes(group = seq_along(x))) +
  theme_dark() +
  theme(axis.title = element_blank(),
        plot.background = element_rect(fill = "grey10"),
        panel.background = element_blank(),
        panel.grid.major = element_line(color = "grey30", size = 0.2),
        panel.grid.minor = element_line(color = "grey30", size = 0.2),
        legend.background = element_blank(),
        axis.ticks = element_blank(),
        legend.key = element_blank(),
        legend.position = c(0.815, 0.27)) +
  shadow_mark() +
  transition_states(z, state_length = 0)